java stack administration
Place the link of the respective java application in the browser and check whether the java application is opening:
For example:
If java is up and running, a screen similar to below will open.
If the page did not open,
i) Check whether there are network issues
ii) Check tablespaces occupancy levels at Oslevel and make sure sufficient space is there and if any tablespace is 100% full, action the same
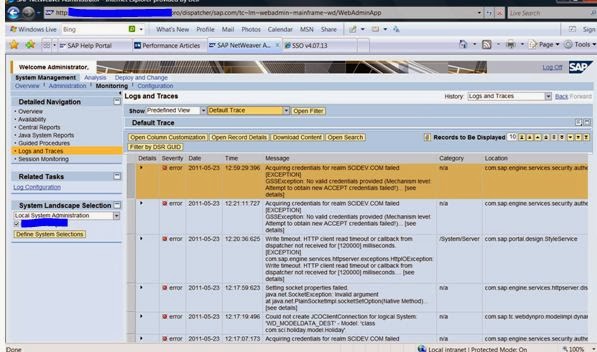
iii) Check the default trace for any critical errors
iv) Check application log to determine any memory related issues
v) Check server node status at oslevel or through management console and action and bring up the java again.
To estimate the user load and to check the number of users logged onto the java portal :
Navigate to User Administration -> Activity Reports
i) Check “Number of users in the last 3 hours” report
ii) To figure out most active users,
Check the 10Most active users report
Java Reports :
Java Memory Consumption Report and Threads Reports :
These reports includes a chart of the memory usage of a cluster node and a chart related to the system and application thread pool.
To check this report login to nwa of the respective java stack :
Then navigate to Monitoring -> Java System Reports :
Here following reports can be taken by selecting the respective report from the drop down provided:
· Capacity Planning : This report includes a chart representing the requests sent to J2EE Engine, a chart for the number of http and security sessions, and a chart of the communication between J2EE nodes
· Resource Consumption : This report includes a chart of the memory usage of a cluster node, and a chart related to the system and application thread pool
· Error Statistics: This report includes a chart representing a collection of counters useful for investigating problems. There are also charts that give an overview of timeouts and the size of log files
· Application Activities : This report includes a chart that represents the history of the activities of deployed applications
· Slowest requests in detail
· Slowest requests
· Slowest components
· User activities
· Current activities
· Monitor Browser
However from monitoring perspective, resource consumption report is most important to analyse the memory consumption.
Select resource consumption from the dropdown to view the memory statistics as below:
Click on Go to Detailed Chart link of the respective report to view detailed chart as below
Click Hint on charts link to analyse the report better.
Select the respective Instance, Cluster node and Time period from the provided dropdown boxes to view the reports belonging to the same
Table view for Threads report:
There are 2 types of views: Chart view and Table view. You can change the view by selecting the respective radio button.
Please find below table view for Memory Consumption report
Session Monitoring:
To check “Logs and Traces”, navigate to System Management -> Monitoring -> Logs and Traces
From the drop down box, different logs can be checked
Process list – List of processes that are currently running can be viewed here and any long running process can be identified and actioned accordingly.
Using Management Console for monitoring Java System :
To open management console for SAP systems based on Unix operating system, add 13 for the port of the portal as mentioned below
A screen similar to below screen will appear :
You can drill down further on SID of the system to view database,Central and SCS instance details as below :
Please note that Management Console can be accessed even when java is down for a sap system.
You can check database status as below :
You can check the javanode status as below:
Status should be running here if java is up
Process list – List of processes that are currently running can be viewed here and any long running process can be identified and actioned accordingly.
SDM, Dispatcher, Server0 and server1 node status can be checked here:
SDM, Dispatcher, Server0 and server1 node status can be checked here:
Various work directory logs, availability log, application log and default trace can be checked here :
Availability log :
Sapstart log:
Dev_jcontrol log :
Dev_server0 log :
To check the status of message and enqueue servers, check the process list under scs instance as mentioned below :
To check various logs related to message server, enqueue server, jcmon check the logs under SCS instance as mentioned below :


No comments:
Post a Comment