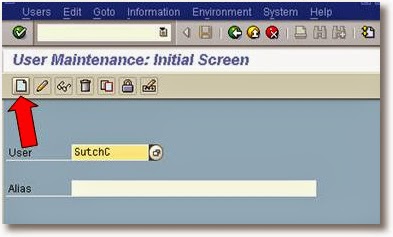
// ]]>

Tuesday 28 January 2014

How to check RFC related errors

How to check RFC related errors

Transactional RFC related checks and maintenance can be done using SM58 transaction code
Sometimes, in real time scenario you can face following issues :
i)  Process chain related performance issues in BIW system due to transactional RFCs stuck in R3 system.
ii)  Idocs flow not happening from R/3 to XI system
In these scenarios, SM58 transaction code will be useful to find out stuck tRFCs and action them accordingly.
Please login into SAP system and use SM58 as shown below :

Using  SM58, we can select TRFCs based on
i)  Any  2 dates
ii)  User id
iii)  Function of TRFC
iv)  TRFC Destination
v)   TRFC Status
If you would like to list all, then use * as input in these fields

In the following screen, you can see the list of TRFCs that are waiting to be processed or stuck tRFCs as shown below

We can delete or re-process these LUWs based on the scenario. This can be done by navigating to Edit menu as shown below


You can reprocess an tRFC  LUW, by selecting the same and  by navigating to Edit -> Execute LUW. This can also be done by  pressing F6 button.
An LUW can also be debugged by navigating to Edit -> Debug LUW option
In case large number of tRFCs are stuck, all of them can be processed at a time by selecting
Edit -> Execute LUWs option as shown in the above screen.
You can also directly goto QRFC administration and QOUT scheduler from  SM58 transaction  as shown in the below screen.


LiveCache Monitoring

LiveCache Monitoring

monitor  various paramaters, parmeter history, OMS locks, SQL locks,  cache usage, exclusive waits, database messages, various configuration related to memory. 
LC10 transaction and providing LCA in the name of database connection as below. Click on Pushbutton “Livecache Monitoring” .

System redirects to the following screen.  As shown, in the screen, please click on “ Activity Overview” item  to view details/statistics  related to
ü  SQL Statements
ü  I/O Activity
ü  Lock Activity
ü  Logging Activity
ü  Scan and Sort Activity
To view OMS locks (or logical object locks) , navigate to LCA->  Problem Analysis ->  OMS locks -> Overview  as shown in the  below screen.

To view exclusive waits, navigate to LCA -> Problem Analysis -> SQL Locks -> Waits as shown in the below screen

To view existing SQL Locks and SQL lock requests, navigate to LCA -> Problem Analysis -> SQL Locks -> Overview as shown in the below screen

To check database manager messages, navigate to LCA -> Problem Analysis -> Messages -> Database Manager as shown in the below screen.

To view the defined parameters and their values in the live cache system, navigate to LCA -> Administration -> Configuration -> Parameters  as shown in the below screen

To view the history of the parameters that are changed date wise, navigate to to LCA -> Administration -> Configuration ->Parameter History as shown in the below screen

To view the Cache related information, navigate to LCA -> Current Status -> Memory Areas -> Caches as shown in the below screen.

To view the OMS Heap  related information, navigate to LCA -> Current Status -> Memory Areas -> Heap Usage  as shown in the below screen.

To view the “ Data area”  related information, navigate to LCA -> Current Status -> Memory Areas -> Data Area  as shown in the below screen.

To view the “ Log Area ”  related information, navigate to LCA -> Current Status -> Memory Areas -> Log  Area  as shown in the below screen.


java stack administration

java stack administration
Place the link of the respective java application in the browser and check whether the java application is opening:
For example:
If java is up and running, a screen similar to below will open.

If the page did not open,
i)                     Check  whether there are network issues
ii)                    Check tablespaces occupancy levels at Oslevel and make sure sufficient space is there and  if any tablespace is  100% full, action the same
iii)                  Check the default trace for any critical errors
iv)                  Check application log to determine any memory related issues
v)                   Check server node status at oslevel or through management console and action and bring up the java again.
To estimate the user load and to check the number of users logged onto the java portal :
Navigate to User Administration ->  Activity Reports

i)                    Check “Number of users in the last 3 hours” report

  ii)                    To figure out most active users,
                                    Check the 10Most active users report

Java Reports :

Java Memory Consumption Report and Threads Reports :
These reports includes a chart of the memory usage of a cluster node and a chart related to the system and application thread pool.
To check this report login to nwa of the respective java stack :

Then  navigate to Monitoring -> Java System Reports :

Here following reports can be taken by selecting the respective report from the drop down provided:
·         Capacity Planning : This report includes a chart representing the requests sent to J2EE Engine, a chart for the number of http and security sessions, and a chart of the communication between J2EE nodes

·         Resource Consumption : This report includes a chart of the memory usage of a cluster node, and a chart related to the system and application thread pool

·         Error Statistics:  This report includes a chart representing a collection of counters useful for investigating problems. There are also charts that give an overview of timeouts and the size of log files

·         Application Activities : This report includes a chart that represents the history of the activities of deployed applications

·         Slowest requests in detail
·         Slowest requests
·         Slowest components
·         User activities
·         Current activities
·         Monitor Browser

However from monitoring perspective, resource consumption report is most important to analyse the memory consumption.
Select resource consumption from the dropdown to view the memory statistics as below:

Click on Go to Detailed Chart link of the respective report to view detailed chart as below

Click Hint on charts link to analyse the report better.

Select the respective Instance, Cluster node and Time period from the provided dropdown boxes to view the reports belonging to the same

Table view for Threads report:

There are 2 types of views: Chart view and Table view. You can change the view by selecting the respective radio button.
Please find below table view for Memory Consumption report

Session Monitoring:
To monitor sessions, navigate to Monitoring -> Session Monitoring


To check “Logs and Traces”, navigate to System Management -> Monitoring -> Logs and Traces
From the drop down box, different logs can be checked


Process list – List of processes that are currently running can  be viewed here and any long running process can be identified and actioned accordingly.


Using Management Console for monitoring Java System :
To open management console for SAP systems based on Unix operating system, add 13 for the port of the portal as mentioned below

A screen similar to below screen will appear :

You can drill down further on SID of the system to view database,Central and SCS instance details as below :

Please note that Management Console can be accessed even when java is down for a sap system.
You can check database status as below :


You can check the javanode status as below:
Status should be running here if java is up

Process list – List of processes that are currently running can  be viewed here and any long running process can be identified and actioned accordingly.

SDM, Dispatcher, Server0 and server1 node status can be checked here:

Various work directory logs, availability log, application log and default trace can be checked here :

Availability log :

Sapstart log:

Dev_jcontrol log :

Dev_server0 log :

To check the status of message and enqueue servers, check the process list under scs instance as mentioned below :


To check various logs related to message server, enqueue server, jcmon check the logs under SCS instance as mentioned below :


Sunday 12 January 2014

User Admin

SSAA – System Administration Assistant

The main purpose of the tool is to simplify your work with the SAP System; the administrator can easily locate the most important tasks.

The tasks are grouped according to functions. The different groups are: Administrator Function, Development and Customizing Process, Upgrade Function, Installation Function, Customizing Function, Application Function, Technical Information and System Specification. For more details, see below.

SAP delivers default proposals for the areas Administrator Function, Development and Customizing Process, Upgrade Function, Installation Function, Technical Information and System Specification. You cannot modify these proposals.

The customer can maintain the Customizing function and application function areas. The customer can also define different tasks for the other task areas. For example, an SAP proposal can be copied and then adjusted to the needs of the customer.


 Runs System Administration Assistant program SAPMSRR1 upon execution.


SU01- User Maintenance( Create new user, delete ,lock,Copy Users)
Run T-Code SU01 
To Create a User their are 4 filed are requiered 
1. Title 
2. First Name 
3. Last Name 
4. Password 

Click on create user or press (F8)  from your keyboard 
Maintain User Screen give
Address
Last name (mandatory)
First name
Other communication
Assign other company address

Click 
Click on Logon data Tab on top
Password
Initial password = ******
Repeat Password   =******
User type
Dialog


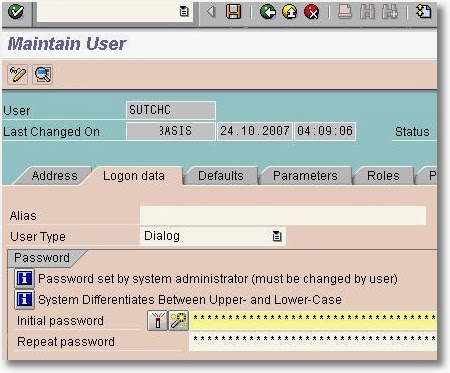
There are 5 different User types:
  1. Dialog
  2. System
  3. Communication
  4. Service
  5. Reference
Dialog users (A)
A normal dialog user is used for all logon types by exactly one person. This is used to logon using SAP GUI. During a dialog logon, the system checks for expired/initial passwords. The user can change his or her own password. Multiple dialog logons are checked and, if appropriate, logged. These users are used for carrying out normal transactions. This is an interactive type of logon. The initial multiple logons are 6. They are set according to companies policy.
System Users (B)
These are non interactive users. They are used for background processing and internal communication in the system (such as RFC users for ALE, Workflow, TMS, and CUA). Their passwords cannot be changed by the end users. Only the user administrator can change their passwords. Multiple logon is permitted in these type of users. Dialog logon is not possible for these type of users.
Communication Users (C)
Used for dialog-free communication between systems. It is not possible to use this type of user for a dialog logon. Their passwords are valid for certain period of time so they expire. The users have option to change their own passwords.
Service User (S)
Dialog user available to a larger, anonymous group of users. The system does not check for expired/initial passwords during logon. Only the user administrator can change the passwords. Generally, highly restricted authorizations are given to this type of users.
Reference User (L)
A reference user is, like the service user, a general non-person-related user. Dialog logon is not possible with this kind of user. A reference user is used only to assign additional authorizations. To assign a reference user to a dialog user, specify it when maintaining the dialog user on the Roles tab page
- See more at: http://www.saptechies.org/type-of-users-in-sap/#sthash.6mr49Kxf.dpuf

If you have a SCOT 


Set local printer


Define a parameter would you like access to the user


Define role like  DB01,DB02,SM50, etc.


Profile such as SAP_ALL,SAP_CUST.


If have a group